Airmid Final Laboratory Report: Influenza

Test Requested Influenza A removal
Sample Description Air Sniper Pro air cleaners
Number of Samples 3
Date of Receipt 18 August 2016
ASC Code ASC003339
Report Number ASCR092180
Report Date 25 October 2016

4. Test Item Description

4.1. Air Sniper Pro Air Cleaner

Three Air Sniper Pro air cleaners were received in airmid healthgroup on August 18th 2016 for testing in the environmental testing chamber.
Figure 4.1. Air Sniper Pro air cleaner photographed at airmid healthgroup

5. Materials and Methods

5.1. Environmental Testing Chamber

The ATSM Environmental Testing Chamber maintains selected temperature and humidity levels over a range of 0.38 to 30.0 air changes per hour. It is constructed from stainless steel with all materials complying with low VOC (Volatile Organic Compounds) emission requirements.
Figure 5.1. Environmental Testing Chamber

5.2. Influenza A

Influenza virus infection is one of the most common and highly contagious infectious diseases and can occur in people of any age. Influenza A viruses are transmitted through direct contact, indirect contact, large respiratory droplets and aerosols (droplets nuclei).

Influenza viruses belong to the Orthomyxoviridae family and are divided into types A, B and C. Influenza types A and B are responsible for epidemics of respiratory illness that are often associated with increased rates of hospitalization and death. During the 20th century, the only influenza A subtypes that circulated extensively in humans were (H1N1) Spanish Flu; (H1N2); (H2N2) Asian Flu; and (H3N2) Hong Kong Flu. A new strain of influenza A, H1N1 emerged in 2009 called ‘Swine Flu’ as it originated in swine and spread to humans. More recently in 2013, a new strain of Avian Influenza A, H7N9 has infected people in China and is believed to be from exposure to infected poultry.

All known subtypes of influenza type A viruses have been isolated from birds and can affect a range of mammalian species. As with humans, the number of influenza A subtypes that have been isolated from other mammalian species is limited. Influenza type B viruses almost exclusively infect humans.

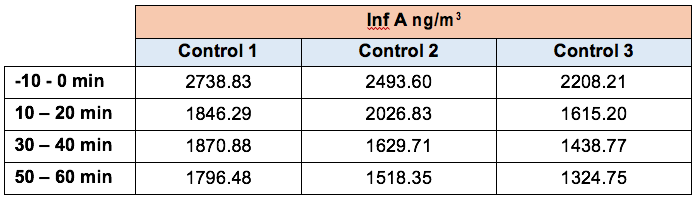
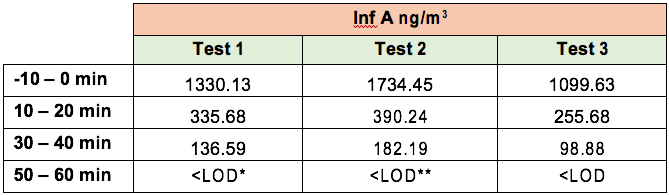
In this study influenza type A virus was used for the testing.

6. Protocol

6.3. Influenza A

In each control or test run, Influenza A (Inf A) live virus was aerosolised into the chamber for 30 minutes at 20 psi. The amount of Inf A nebulised was strictly dependent on the virus stock used, however 100 – 200 µg of virus were introduced for each run in the chamber. The aerosol was mixed in the airstream of the ceiling fan, which was operating at a medium speed for the duration of the introduction. Three SKC BioSamplers collected air samples at a 1 m height for 10 minutes at a rate of 12.5 l/min at the following time points: I. -10 – 0 min
II. 10 – 20 min
III. 30 – 40 min
IV. 50 – 60 min
The first sampling point was taken during the last 10 minutes of the 30 minutes of virus aerosolisation (-10 – 0 min).
Figure 6.1. Sampling scheme for Influenza A test. Sampling time points are indicated by pink lines. “AC” = air cleaner
For the test runs, the Air Sniper Pro air cleaner was switched on at t = 0 minutes and was operated for the duration of the experiment post-virus introduction (Figure 6.2). At the end of the experiment, the samples were removed from the BioSamplers and transferred to sterile 40 ml tubes that were immediately placed on ice and then stored in the laboratory at -20°C until analysis.

6.3.1. Sample Analysis

The concentration of Influenza A (Inf A) collected by the SKC BioSamplers was determined by ELISA (enzyme-linked immunosorbent assay).

ELISA samples were analysed according to the manufacturer’s specifications and samples were read at 450 nm on a BioTek EL 800 Plate Reader. The concentration of Inf A in each sample was quantified as ng per m3 of sampled air.

Virus reduction percentage was calculated according to the formula below:

The sampling pump activity was checked with a rotameter before and after each run to ensure the sampling air volume was constant.

7. Results

7.3. Influenza A Results and Discussion

The recovery concentrations of Inf A in the three control runs (without the A/C operating) and in the three test runs (with the A/C operating) are reported in Tables 7.4 and 7.5. Each result is the average of three replicates sampled at the indicated time. The Inf A concentration was determined by ELISA in units of ng/ml and then converted into ng/m3, i.e. nanograms of Inf A per cubic metre of air sampled by the SKC BioSamplers. The results from Table 7.4 and 7.5 are also represented in Figures 7.9 and 7.10.
Table 7.4. Average Inf A concentration detected in the control runs.
Table 7.5. Average Inf A concentration detected in the test runs.
*LOD=below the limit of detection (1.28 ng/m3)
**For this sampling point two out of three replicates were not available due to a technical problem occurred during the sampling process
Tables 7.4 and 7.5 show the trend of Inf A levels over time in the three control and test runs, respectively. During the control runs (Table 7.4) slight fluctuations in Inf A concentration were observed. In contrast the rapid reduction in Inf A concentration observed in the test runs (Figure 7.10) could not be attributed to natural decay due to forces exerted on the virus particles, i.e. inertia, diffusion. In the three test runs, after 50 to 60 minutes of A/C operation the Inf A concentration had dropped below the detection limit of the assay used to quantify the virus. The initial virus concentrations in the three test runs were 1330.13 ng/m3 for test run 1 and 1734.45 and 1099.63 ng/m3 for test runs 2 and 3. The slight differences among the sampling time points in the control runs can be ascribed to the sampling process itself. As reported by Fabian et al. in 2009, SKC Bio Samplers represent the most efficient airborne virus particle sampling tool in terms of virus infectivity preservation and collection efficiency. Despite this, the BioSampler recovery efficiency is about 79% for particles sized > 0.3 µm, which may lead to variation in the collected concentrations of Inf A particles sized ~ 0.1 µm.
Figure 7.9. Influenza A concentration (represented on a logarithmic scale) in the test chamber during control runs performed without the Air Sniper Pro air cleaner operating. Each sampling point represents the average of three replicates.
Figure 7.10. Influenza A concentration (represented on a logarithmic scale) in the test chamber during test runs performed with the Air Sniper Pro air cleaner operating. Each sampling point represents the average of three replicates.
The data presented here show that within the first 60 minutes of the Air Sniper Pro operation, the Influenza A concentration in the test chamber was reduced to less than 1.28 ng/m3 (the detection limit of the assay performed to quantify the collected airborne virus is 0.16 ng/ml). Figure 7.11 shows the percentage reduction in Inf A levels (calculated according to the formula cited above in Section 6.2.3) during the control and test runs. Fluctuations in virus concentration from 20 to 30% were observed during control runs. Statistical fluctuations are unavoidable, especially for a test like the one described in this report. Several factors affect the outcome of the final result. The sampling process and the assay bring their own variability, and one must not forget that the virus, adapted to the ideal ‘survival’ environment of the human body, is nebulized into an indoor space with certain physical characteristics, where physical forces such as inertia and diffusion are applied on the viral particles throughout the test duration (Hind 1999, U.S. EPA 2010, Lee et al. 2011). The nebulized virus may also adhere to the chamber surfaces after a certain period of time or move to areas of the chamber with lower or null concentration of virus, with a consequent variation in the amount of particles collected by the SKC Bio Samplers. In contrast a 99.9% decrease in Inf A levels is observed in the test runs at the first sampling time after the Air Cleaner is turned on.
Figure 7.11. Average Influenza A percentage reduction during test and control runs (n=3)

8. Conclusions

The Air Sniper Pro air cleaner was demonstrated to be effective in reducing airborne Influenza A aerosols in the test chamber, reaching 99.9% airborne virus reduction within the first 50 – 60 minutes of operation. Influenza A was not detectable by ELISA in any of the samples collected after 60 minutes of Air Sniper Pro operation. These results indicate that in the presence of an operational unit the Influenza A concentration in the test chamber was reduced to levels below the 1.28 ng/m3, detection limit of the assay performed to quantify the collected airborne virus.

9. References

1) United States Environmental Protection Agency. EPA-454/B-13-001. Technical Assistance Document for the reporting of Daily Air Quality – The Air Quality Index (AQI). 2013.

2) World Health Organization. WHO Indoor Air Quality Guidelines: Formaldehyde, Chapter 5.8. WHO Regional Office for Europe, Copenhagen, Denmark. 2001

<