Airmid Final Laboratory Report: Escherichia virus MS2
(Induct 300W)

| Sample Description | Air Sniper Induct 300W Air Purifier |
| Number of Samples | 1 |
| Date of Receipt | 02 November 2021 |
| ASC Code | ASC004236 |
| Report Number | ASCR092529 |
| Report Date | 10 December 2021 |
1. Purpose
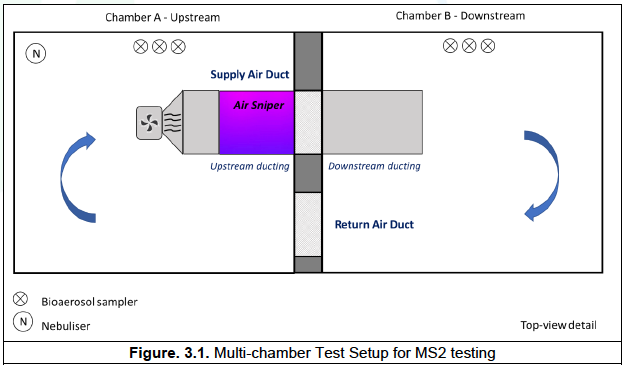
To test the Air Sniper induct 300 unit against aerosolised Escherichia virus MS2 in a multi-chamber set-up consisting of two 28.5m3 environmental test chambers linked via ducting to allow for air to recirculate between the chambers.
2. Test Item Description
The Air Sniper induct 300 unit received by airmid healthgroup on 2nd November 2021 (internal airmid code ASC004236) was installed in an Environmental Test Chamber (Figure 2.1).
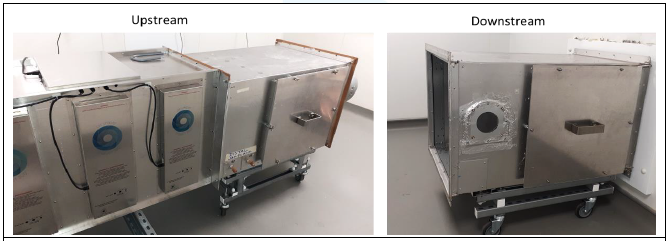
Figure 2.1. Air Sniper Induct 300 unit installed inside the chamber at airmid healthgroup
3. Materials
3.1. Bacteriophage MS2 (MS2)
Bacteriophage MS2 (MS2) is a non-enveloped virus that infects Escherichia coli and some other closely related bacteria but has not been shown to infect eukaryotes. Like SARS-CoV- 2, MS2 is a single-stranded RNA virus. However, at approximately 27 nm in diameter, MS2 is much smaller than the 120 nm diameter SARS-CoV-2 virus. Because MS2 has similar aerosol characteristics to human viruses, it is often used in air purifiers and air filtration tests as a surrogate for viruses of similar or larger dimensions [1]. For example, MS2 has been used as a surrogate for Norovirus, including studies where MS2 has been aerosolised [2] and where viral inactivation by ultraviolet light has been assessed [3, 4]. MS2 is one of the bioaerosols recommended for air filtration tests by the EPA [5]. A study of the effect of UV exposure on virus aerosols found that MS2 was more resistant than the murine hepatitis virus (MHV) coronavirus to UV air disinfection [6]. Aerosols of the MHV coronavirus were found to be 7 – 10 times more susceptible than MS2 [6]. Therefore, MS2 is a conservative surrogate for coronaviruses in this type of testing. However, as stated by the FDA: “…currently there is limited published data about the wavelength, dose, and duration of UVC radiation required to inactivate the SARS-CoV-2 virus” [7]. Based on the requirements for aerosolisation, the use of ultraviolet light as the antiviral technology and its suitability as a surrogate for some human viral pathogens, MS2 was used as the challenge microorganism in this study.
3.2. 28.5 m3 Environmental Test Chambers
Testing was conducted using two 28.5 m3 test chambers purpose-built to comply with the American Society for Testing and Materials (ASTM) standard. The test chambers are connected via modular ducting (supply and return) and allow for recirculation of air between the two chambers. Both chambers have HEPA filtered supply air and can maintain selected temperature and humidity levels at a wide range of air change rates. The air change rate in the chambers can be controlled within a range of 0.5 to 20 air changes per hour. The chambers are constructed using powder-coated stainless steel with all materials complying with low volatile organic compound (VOC) emission requirements. Both chambers comply with cleanroom standards, are sealable from the exterior environment and are accessed via an anteroom with interlocking doors.
Chamber A – upstream, contained the Air Sniper induct 300 unit and supply fan.
Chamber B – downstream, contained a post-exposure duct section (Figure 3.1).
4. Procedure
Six decay tests were performed as outlined below using a bespoke duct supplied by Air Sniper:
Active Test: conducted in triplicate with the Air Sniper Induct 300 unit operating
Inactive Control: conducted in triplicate without the Air Sniper Induct 300 unit operating
- The chambers were preconditioned before testing to 20°C (±3°C) and 50 % RH (±5 %). A UV-C light in the ceiling of the test chambers sterilised the surfaces for 1 h before testing.
- The Air Sniper induct 300 unit with a bespoke duct and blower fan was installed in Chamber A and a duct was installed in Chamber B downstream (Figure 3.1). A fan, calibrated to 1500 CFM using a hotwire thermal anemometer (testo 405i, Smart Probe), was used to blow air through the ducting in both test and control runs.
- Background air samples were taken using SKC BioSamplers 1.0 m from the floor at 11.5 l/m.
- MS2 was aerosolised upstream (into Chamber A) for up to 20 min. Mixing fans were operated to promote the homogenous distribution of the aerosol throughout the test chambers.
- To estimate the concentration of the virus after aerosolization, triplicate air samples (T0, -6 to -1 minutes) were collected in both test chambers.
- In active test runs, at time -1 minute (i.e., immediately after the T0 sample was taken) the Air Sniper induct 300 unit was operated. The blower fan was turned on 1 minute after the Air Sniper unit began operating. Inactive control runs were conducted identically to the active test but without Air Sniper induct 300 unit operating.
- 2.5 to 7.5 minutes (T7.5)
- 10.0 to 15.0 minutes (T15)
- 25.0 to 30.0 minutes (T30)
- 55.0 to 60.0 minutes (T60)
- After each run, all air samples were transferred to the laboratory for analysis. The chambers were cleaned, sterilised using UV-C lights and preconditioned for the next run.
4.1. Sample Analysis
Samples collected from the test chambers were analysed by plaque assay, which assesses the infectivity of the sampled virus. By applying samples to a Petri plate pre-prepared with a lawn of E. coli, the concentration of viable virus in that sample can be determined by quantifying the number of plaques formed after incubation. The concentration of infective MS2 virus was denoted as the number of plaque-forming units per cubic meter of air (PFU/m3). These values were reported logarithmically (Log10).
By comparing the concentration of virus in the samples collected in the test runs to the control runs, the efficacy of the device to remove airborne virus from the environmental test chambers over time can be determined.
5. Results
Tables 5.1 & 5.2 summarise the concentration of MS2 measured in the Upstream and Downstream test chambers in control runs, while Tables 5.3 & 5.4 summarise the test run results. Figure 5.1 presents the average of the triplicate test and control runs in each chamber.

Table 5.1. MS2 in the Upstream chamber during control runs (without Air Sniper induct 300 operating)

Table 5.2. MS2 in the Downstream chamber during control runs (without Air Sniper induct 300 operating)

Table 5.3. MS2 in the Upstream chamber during test runs (with Air Sniper induct 300 operating)

Table 5.4. MS2 in the Downstream chamber during test runs (with Air Sniper induct 300 operating)
≤LOD: less than the limit of detection (8.70E+03 PFU/m3 or 3.94 Log10 PFU/m3). N/a: not applicable. Averages were calculated using the 8.70E+03 PFU/m3 limit of detection.
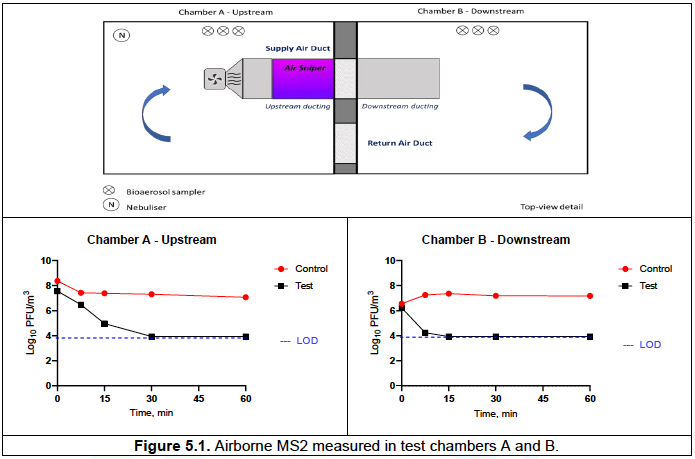
In chamber A, over 60 min in the control runs the concentration of MS2 reduced from an average of 8.37 to 7.07 Log10 PFU/m3, whereas in the test runs MS2 was not detected (limit of detection 3.94 Log10 PFU/m3) after 30 min of unit operation.
In chamber B, in the control runs the concentration of MS2 varied between 6.55 Log10 PFU/m3 at T0 and 7.18 Log10 PFU/m3 recorded at T60. In the test runs, the concentration of MS2 reduced from 6.23 Log10 PFU/m3 recorded at T0 to 4.24 Log10 PFU/m3 after 7.5 min (T7.5) of unit operation and was below the detection limit at T15, T30, and T60).
Figure 5.2 presents an average concentration of MS2 (Log10 PFU/m3) in the upstream and downstream chambers for control (Tables 5.1 & 5.2) and test (Tables 5.3 & 5.4) runs.
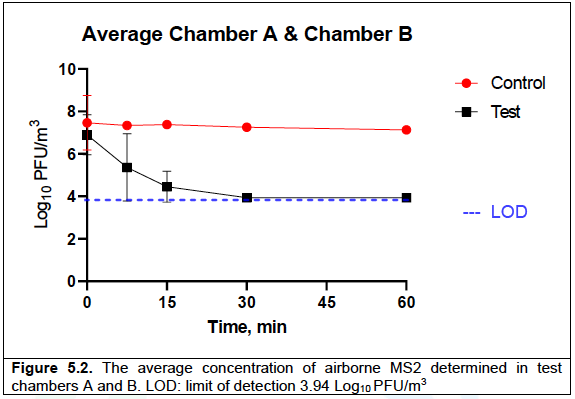
In the control run, the average concentration of MS2 in chamber A and chamber B reduced from 7.46 ±1.29 to 7.12 ±0.08 Log10 units over the 60 min of testing. In the test run, at time 0, the average concentration of MS2 was 6.90 ±0.93 Log10 PFU/m3, which reduced to 5.36 ±1.58 and 4.45 ±0.73 after 7.5 and 15 min of Air Sniper induct 300 operation, respectively, and was below the detection limit (LOD ≤3.94 Log10 PFU /m3) after 30 min of testing (at T30 and T60).
Table 5.5 presents a sum of the MS2 concentrations in the upstream (Table 5.1) and downstream (Table 5.2) chambers for each control run. Table 5.6 presents a sum of the MS2 concentrations in the upstream (Table 5.3) and downstream (Table 5.4) chambers for each test run. Both tables also include the resulting average/standard deviation and corresponding Log10 values. The summed data are also represented in Figure 5.3.

Table 5.5. Sum of the concentrations of MS2 (Chamber A + Chamber B) in control runs.

Table 5.6. Sum of the concentrations of MS2 (Chamber A + Chamber B) in test runs.
Resulting limit of detection (1.74E+04 PFU/m3 or 4.24 Log10 PFU/m3). N/a: not applicable. Averages were calculated using the 1.74E+04 PFU/m3 limit of detection.
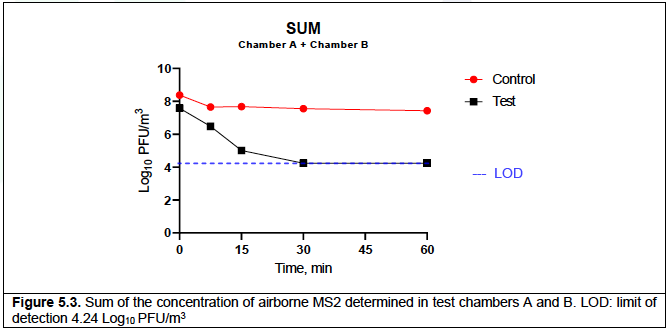
When considering the summed concentration of MS2 in both test chambers, over 60 min of testing, in the control run the concentration reduced from an average of 8.38 Log10 PFU/m3 to 7.43 Log10 PFU/m3, while in the test run it reduced from an average of 7.58 Log10 PFU/m3 to below the limit of detection (4.24 Log10 PFU /m3) (Table 5.3, Figure 5.3).
6. Conclusion
The data in this report demonstrated that in the inactive control runs the sum concentration of MS2 in both chamber A and B reduced from 8.38 Log10 PFU/m3 to 7.43 Log10 PFU/m3 after 60 min of testing, a reduction of 88.8%.
In contrast, in the active test runs with the Air Sniper induct 300 unit operating the concentration of airborne MS2 reduced from 7.58 Log10 PFU/m3 to less than the limit of detection (4.24 Log10 PFU/m3) after 30 minutes, which corresponds to a reduction of >99.9%.
7. References
1) John Zhang, Ph.D.; Doug Huntley; Andy Fox; Bryan Gerhardt; Al Vatine; John Cherne. Study of Viral Filtration Performance of Residential HVAC Filters. ASHRAE Journal, Vol. 62, no. 8, August 2020
2) Tung-Thompson G, Libera DA, Koch KL, de los Reyes FL III, Jaykus L-A (2015) Aerosolization of a Human Norovirus Surrogate, Bacteriophage MS2, during Simulated Vomiting. PLoS ONE 10(8): e0134277. https://doi.org/10.1371/journal.pone.0134277
3) G.W. Park, K.G. Linden, M.D. Sobsey (2010) Inactivation of murine norovirus, feline calicivirus and echovirus 12 as surrogates for human norovirus (NoV) and coliphage (F+) MS2 by ultraviolet light (254 nm) and the effect of cell association on UV inactivation. Letters in Applied Microbiology (Volume 52, Issue 2, Pages 162-167). https://doi.org/10.1111/j.1472- 765X.2010.02982.x
4) Jung Eun Lee, GwangPo Ko (2013) Norovirus and MS2 inactivation kinetics of UV-A and UV- B with and without TiO2. Water Research (Volume 47, Issue 15, Pages 5607-5613). https://doi.org/10.1016/j.watres.2013.06.035
5) EPA. 2006. “Generic Verification Protocol for Biological and Aerosol Testing of General Ventilation Air Cleaners.” Cooperative Agreement R-83191101. U.S. Environmental Protection Agency
6) Christopher M. Walker and GwangPyo Ko. Effect of ultraviolet germicidal irradiation on viral aerosols. Environ. Sci. Technol. 2007, 41, 5460–5465 https://doi.org/10.1021/es070056u
7) UV Lights and Lamps: Ultraviolet-C Radiation, Disinfection, and Coronavirus https://www.fda.gov/medical-devices/coronavirus-covid-19-and-medical-devices/uv-lights- and-lamps-ultraviolet-c-radiation-disinfection-and-coronavirus

