Airmid Final Laboratory Report: Mold

Test Requested Aspergillus Niger removal
Sample Description Air Sniper Pro air cleaners
Number of Samples 3
Date of Receipt 18 August 2016
ASC Code ASC003339
Report Number ASCR092180
Report Date 25 October 2016

1. Purpose

The purpose of this study was to evaluate the forced decay of formaldehyde by the Air Sniper Pro Air Cleaner in a 30 m3 environmental test chamber in comparison to natural decay of formaldehyde in the absence of the air cleaner.

As previously reported in Interim Report ASCR092177, the purpose of the study was also to determine the performance of the Air Sniper air cleaner at removing airborne Aspergillus niger mold spores from within a sealed indoor space. The results reported in Interim Report ASCR092177 (removal of airborne Aspergillus niger mold spores and by the Air Sniper Pro Air Cleaner) are also presented here to complete this final report.

2. Background

Following discussions between Alpine Innovative Research (AIR) and airmid healthgroup it was agreed that testing would be performed on the Air Sniper Pro air cleaner to study the effect of the air cleaner on a number of airborne contaminants. The selected contaminants were Aspergillus niger mold spores. Testing was performed in airmid healthgroup’s environmental test chambers.

3. Abbreviations used in this report

A/C: air cleaner
CFU/m3: colony forming units per cubic meter (in this report, the level of airborne mold)
CFU: colony forming units
HCHO: formaldehyde
Inf A: Influenza A
N/a: Not applicable
PDA: potato dextrose agar
ppm: parts per million
RD: room disturbance

4. Test Item Description

4.1. Air Sniper Pro Air Cleaner

Three Air Sniper Pro air cleaners were received in airmid healthgroup on August 18th 2016 for testing in the environmental testing chamber.
Figure 4.1. Air Sniper Pro air cleaner photographed at airmid healthgroup

5. Materials and Methods

5.1. Environmental Testing Chamber

The ATSM Environmental Testing Chamber maintains selected temperature and humidity levels over a range of 0.38 to 30.0 air changes per hour. It is constructed from stainless steel with all materials complying with low VOC (Volatile Organic Compounds) emission requirements.
Figure 5.1. Environmental Testing Chamber

5.2. A. niger Mold

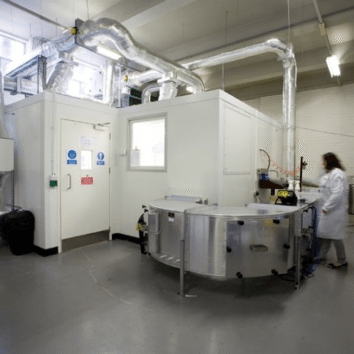
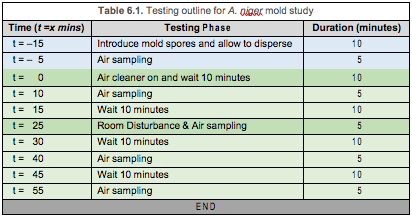
10 g of dust spiked with 1×10⁷ of A. niger mold spores was introduced into the environmental testing chamber. A ceiling fan operating at full speed dispersed the dust and allowed it to homogenise throughout the chamber over a 10-minute period. Five minutes before the air cleaner was turned on (t = –5) triplicate 5-minute air samples were collected onto Potato Dextrose Agar (PDA) plates using SKC Bio-Impactors.

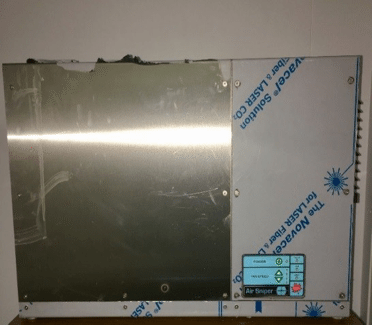
The procedure was as follows (Table 6.1). At t = 0 the Air Sniper Pro air cleaner was turned on, and operated at the highest fan speed. The air cleaner was operating for the remaining duration of the experiment. Triplicate airborne samples were taken at t = 10, t = 25, t = 40, and t = 55. A room disturbance was conducted in conjunction with the airborne sampling at t = 25. The room disturbance consisted of walking systematically around the inside of the chamber and bouncing a ball to disturb as much of the settled dust as possible.

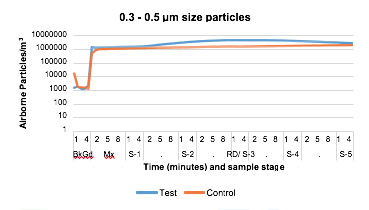
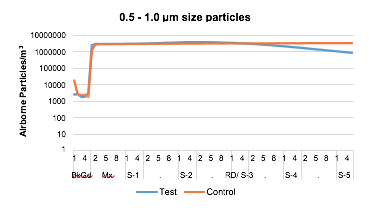
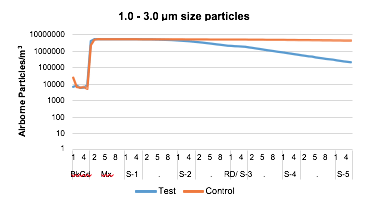
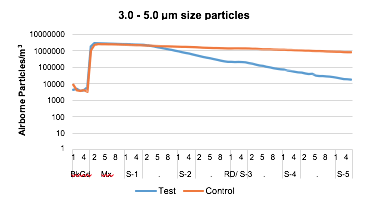
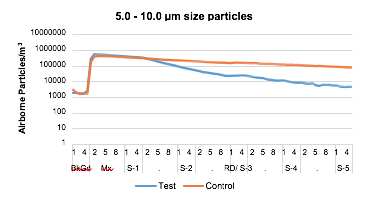
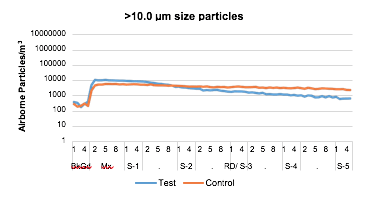
The PDA plates were collected at the end of the experiment and incubated at 25 °C for 72 hours. The plates were then examined for mold, and any mold colonies present were counted. A particle counter was set up inside the chamber to monitor airborne particle counts during each experiment. This device monitors airborne particles across six different size channels
0.3 – 0.5 µm, 0.5 – 1.0 µm, 1.0 – 3.0 µm, 3.0 – 5.0 µm, 5.0 – 10.0 µm and >10.0 µm.

The chamber was cleaned and sterilized using UV-C light before the next run. Each test run was conducted in triplicate. The control runs consisted of the same protocol as the test except the Air Sniper Pro air cleaner was absent.
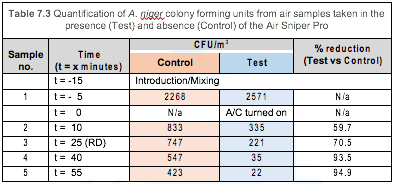
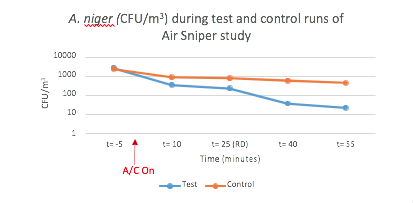
7. Results

7.2. Mold Results

7.2.1. Quantification of Aspergillus niger

Three air samples were taken at each time point during each experimental run. Test and control runs were performed in triplicate.

Figure 7.2 Graphical representing the results from Table 7.1 of the total number of A. niger CFUs measured in the environmental chamber during the test and control runs. y axis is a logarithmic scale
The ATSM Environmental Testing Chamber maintains selected temperature and humidity levels over a range of 0.38 to 30.0 air changes per hour. It is constructed from stainless steel with all materials complying with low VOC (Volatile Organic Compounds) emission requirements.

7.2.2    Particle Counts

Particle counts measured during the test and control runs are presented in Figures 7.3 to 7.8. In each of the figures: BkGd = Background, Mx = Mixing, S-1 = Sample 1, S-2 = Sample 2, RD/S-3 = Room Disturbance and Sample 3, S-4= Sample 4, S-5 = Sample 5

Figure 7.3. Graph representing the number of 0.3 – 0.5 µm size airborne particles recorded from inside the environmental test chamber during the test and control runs of the Air Sniper Pro A. niger mold study. y axis is a logarithmic scale.
Figure 7.4. Graph representing the number of 0.5 – 1.0 µm size airborne particles recorded from inside the environmental test chamber during the test and control runs of the Air Sniper Pro A. niger mold study. y axis is a logarithmic scale.
Figure 7.5. Graph representing the number of 1.0 – 3.0 µm size airborne particles recorded from inside the environmental test chamber during the test and control runs of the Air Sniper Pro A. niger mold study. y axis is a logarithmic scale.
Figure 7.6. Graph representing the number of 3.0 – 5.0 µm size airborne particles recorded from inside the environmental test chamber during the test and control runs of the Air Sniper Pro A. niger mold study. y axis is a logarithmic scale.
Figure 7.7. Graph representing the number of 5.0 µm size airborne particles recorded from inside the environmental test chamber during the test and control runs of the Air Sniper Pro A. niger mold study. y axis is a logarithmic scale.
Figure 7.8. Graph representing the number of >10.0 µm size airborne particles recorded from inside the environmental test chamber during the test and control runs of the Air Sniper Pro A. niger mold study. y axis is a logarithmic scale.

Other than for the 0.3 – 0.5 µm size particles (Figure 7.3) there is a reduction in airborne particles across all other size ranges. A. niger mold spores are around 2 – 3.5 µm size. Therefore, the reduction of A. niger mold spores, as a result of the Air Sniper Pro, is best represented by Figures 7.5 and 7.6.

For the 0.3 – 0.5 µm size particles (Figure 7.3) there was an increase in airborne particles after the Air Sniper Pro was turned on. We speculate that this could be due to larger particles being degraded into smaller size fragments by the operation of the air cleaner.

8. Conclusions

The results presented for formaldehyde removal from the air in the environmental test chamber, demonstrate that after 52 min of operation the Air Sniper Pro was only capable of increasing the rate of formaldehyde decay by an additional 20% of that which occurred by natural decay. Formaldehyde levels remained at about five times greater than the 0.1 ppm upper limit recommended for residences by the EPA1. In addition, the World Health Organization (WHO) gives a reference concentration of 0.081 ppm for formaldhyde2. A considerably longer operation time for the Air Sniper Pro may be required to effectively reduce formaldehyde to safe levels in the environmental chamber. Further tests are recommended to verify this.

The Air Sniper Pro was demonstrated to be capable of reducing the levels of Aspergillus Niger mold spores by 94.9% after 55 – 60 minutes of air cleaner operation when compared to the control runs.

The Air Sniper Pro air cleaner was demonstrated to be effective in reducing airborne Influenza A aerosols in the test chamber, reaching 99.9% airborne virus reduction within the first 50 – 60 minutes of operation. Influenza A was not detectable by ELISA in any of the samples collected after 60 minutes of Air Sniper Pro operation. These results indicate that in the presence of an operational unit the Influenza A concentration in the test chamber was reduced to levels below the 1.28 ng/m3, detection limit of the assay performed to quantify the collected airborne virus.

9. References

1)   United States Environmental Protection Agency. EPA-454/B-13-001. Technical Assistance Document for the reporting of Daily Air Quality – The Air Quality Index (AQI). 2013.

2)   World Health Organisation. WHO Indoor Air Quality Guidelines: Formaldehyde, Chapter 5.8. WHO Regional Office for Europe, Copenhagen, Denmark. 2001